Service hotline
+86 0755-83044319

release time:2022-03-17Author source:SlkorBrowse:12504
Oscilloscope is the most important power testing and characterization tool. At present, many oscilloscopes can provide special power supply measurement options to help engineers automatically complete many important tests, such as InfiniiVision X of German Technology. Series oscilloscope. Power supply not only needs to be measured in time domain, but also in frequency domain. The frequency measurement includes control loop response (Bode diagram) and power supply rejection ratio (PSRR). This kind of specific excitation response measurement is usually done by low frequency network analyzer, but some new oscilloscopes have built-in function/ Arbitrary waveform generator, so it can also be used for this kind of measurement. The following is a description of the corresponding test of the switching power supply loop.
Control loop response (Bode diagram)
The power supply is actually an amplifier with a negative feedback control loop, as shown in Figure 1. This means that although you can think of the power supply as a DC amplifier, it will actually amplify AC signals and respond to changes in output conditions, such as load changes.
In order to realize the response test of the control loop, it is necessary to inject an error signal into the feedback path of the control loop. In Figure 1, this feedback path refers to the resistor divider network of R1 and R2. A smaller resistor needs to be connected in series in the feedback loop to inject an error signal. The 5ohm injection resistance shown in the schematic diagram is insignificant compared with the series impedance of R1 and R2. Therefore, it may be considered to use this low resistance injection resistor (Rinj) as a long-term test device. Another injection transformer (such as Picotest J2101A) is used to isolate the AC interference signal, so as not to generate any DC bias.
The measurement system here is an oscilloscope with built-in WaveGen function/arbitrary waveform generator, which can measure the AC voltage level on the top of the feedback network (Vin) and the DC output (Vout) of the power supply. The oscilloscope can also calculate the gain at each test frequency point in the scanning frequency band, dB=20Log(Vout/Vin). Meanwhile, the phase difference between Vin and Vout is also measured.
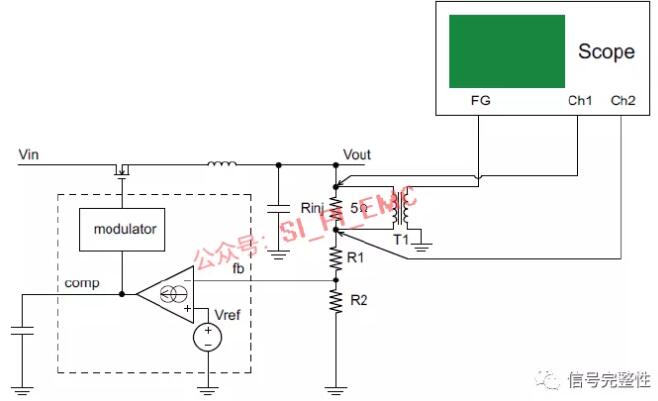
Figure 1: Connection settings of power supply closed-loop feedback network and oscilloscope during loop response test
And input and output detection.
Accurate testing technology is a necessary condition for loop response testing. And the ripple voltage of Vin and Vout at some test frequency points is very small, which is easily drowned by the background noise of oscilloscope or the noise of the power supply under test. Improving the signal-to-noise ratio of the test can improve the dynamic range of the frequency response test. Although most oscilloscopes are equipped with 10:1 passive probes as standard, using 1:1 passive probes can better reduce the influence of oscilloscope noise and power switch noise, thus improving the signal-to-noise ratio of the test. If you are using the oscilloscope of DeTech, it is recommended to use the 1:1 passive probe N2780A with 35MHz bandwidth for loop response test.
Shortening the length of the ground wire of the probe is also helpful for this test. The standard grounding wire of the probe sometimes absorbs the switching noise like an antenna. If there are terminals near the Vin and Vout test points, you can remove the standard long grounding wire and probe cap, and then directly lean the probe and the ground at the front end of the probe against the terminals as shown in Figure 2. If there is no binding post, find a closer grounding point on the PCB, and then make a shorter grounding connection by using the spring grounding accessory provided with the passive probe, or reserve a probe interface on the PCB during the design, which can obtain the best low-noise grounding connection without fixing the probe by hand.
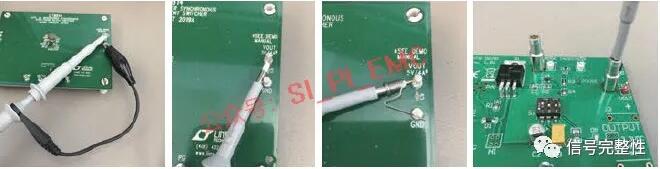
Figure 2: Measuring with a short ground wire can provide the best signal-to-noise ratio in the loop response test.
Perform loop response measurement.
Fig. 3 shows the isolation transformer and 1:1 passive probe that need to be configured for loop response test of a switching power supply evaluation board. The isolation transformer uses N2101A injection transformer of Picotest. This power supply test board has been designed with a 5 ω injection resistor in the feedback loop.
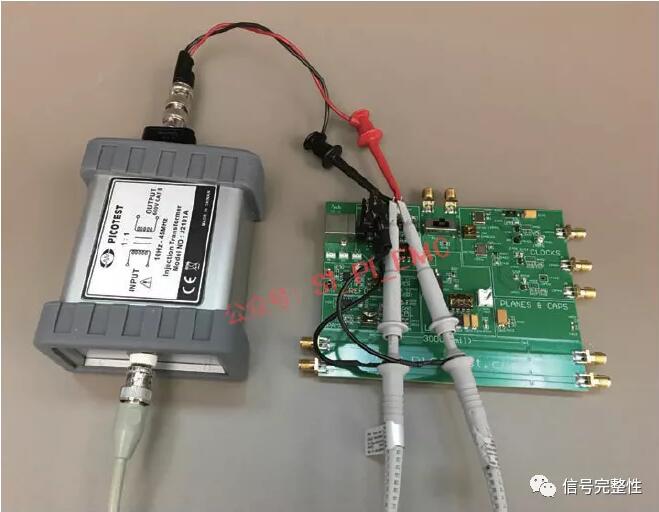
Figure 3: Configuration of Loop Response Test Isolation Transformer and 1:1 Passive Probe
The loop response test needs to use an oscilloscope with power test option (take the software of InfiniiVision X series oscilloscope as an example). The first step is to select the loop response test in the list of power test items, and then select the settings & application menu as shown in Figure 4. We first use the default settings of 200mVpp peak-to-peak value and 50Ω impedance to conduct this test. As the injection resistance connected to the isolation transformer is only 5Ω, the actual voltage applied to the injection resistance is only about 36 MVPP.
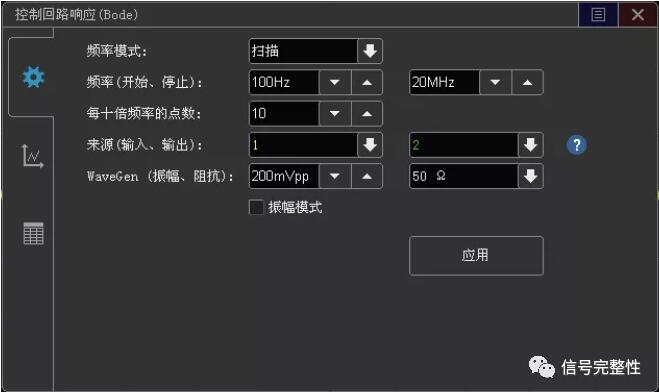
Figure 4: Loop Response Test Parameter Settings
Please note that most frequency response analyzers or vector network analyzers set the injection voltage with Vrms or dBm and based on 50Ω injection resistance. If you want to compare the test results of different devices (oscilloscope, frequency response analyzer, network analyzer), even when the voltage units are different (Vpp, Vrms, dBm), make sure that the injection voltage settings are the same.
Click the "Apply" button directly after setting the test parameters, as shown in Figure 5. Blue-green and orange are curves of gain and phase in the scanning frequency range of 100Hz to 20MHz, respectively. The oscilloscope also automatically displays the phase margin (PM) and gain margin (GM) test results in the lower left corner of the screen.
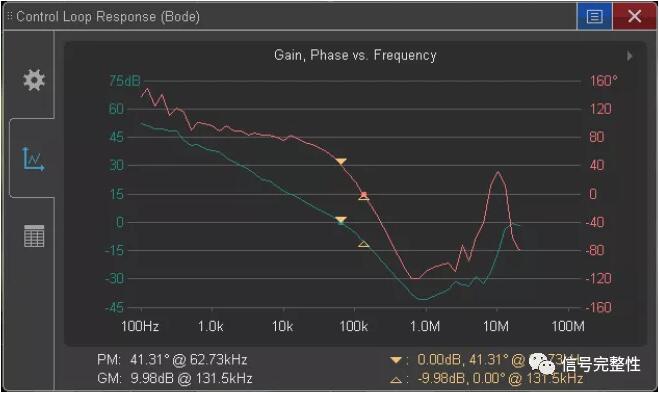
Figure 5: Gain curve and phase curve of loop response test at fixed injection voltage
We can see the jitter of gain and phase results at low frequency in the test results, which indicates that the signal-to-noise ratio may be too low at this frequency. A simple way to improve the signal-to-noise ratio is to increase the injection voltage amplitude in all frequency bands. However, increasing the injection voltage may cause signal distortion or the corresponding phase margin result of 0dB crossing is incorrect.
A better way to improve the signal-to-noise ratio is to customize different injection voltages by using the amplitude configuration function in the measuring tool shown in Figure 6. Through the amplitude configuration function, you can use low amplitude injection voltage in the frequency range where the power under test is sensitive and high amplitude injection voltage in the frequency range where the power under test is insensitive. Generally, the switching power supply feedback network is most sensitive near the 0dB crossing point, and the power board we measured is about 60KHz.
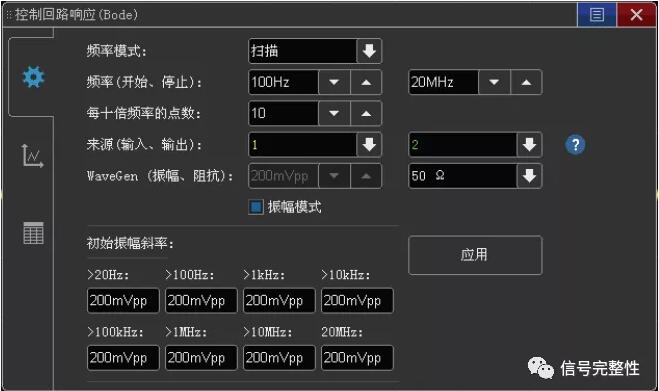
Figure 6: Optimizing SNR with Amplitude Configuration
Fig. 7 shows the test results of the loop response gain and phase after customizing the injected voltage. It can be seen that the jitter of the test results caused by insufficient signal-to-noise ratio is obviously very small.
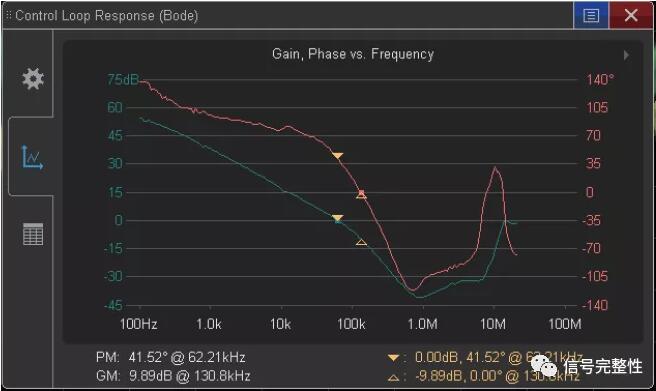
Figure 7: Gain and phase test results after optimized injection voltage configuration
How to determine the most suitable injection voltage? Some engineers suggested that a relatively high injection voltage should be used for the test at the beginning, and then the amplitude should be gradually reduced for several tests until the 0dB crossover frequency is stabilized at a certain frequency point. Generally, the frequency response test iterates the appropriate injection voltage to get the best dynamic range.
You can also use an oscilloscope to measure the phase and gain of a single frequency point, for example, at a frequency point near the expected 0dB crossing frequency, and then manually adjust the voltage and frequency of the injected signal in the waveform generator setting menu of the oscilloscope, and visually observe the change of the real-time waveform.
For example, as shown in fig. 5, run the test of the whole sweep frequency range with a fixed low injection voltage to determine the approximate 0dB crossover frequency. In this example, we know that the 0dB crossover frequency is about 62KHz, and then run the test of a single frequency point of 62KHz and gradually increase the injection voltage until the signal distortion is observed. Once the maximum injection voltage around the 0dB crossover frequency is determined, the injection voltage can be simply used in all frequency bands. More single frequency point tests can be conducted at different frequency points to optimize the injection voltage amplitude at low frequency or high frequency.
summary
Oscilloscope is the most basic measuring equipment for engineers to test and characterize power supply design. Now, not only can oscilloscope be used to measure time-domain ripple and noise, but also frequency-domain parameters such as control loop response (Bird diagram) and power supply rejection ratio (PSRR) can be carried out.
Disclaimer: This article is reproduced from "Signal Integrity". This article only represents the author's personal views, not those of Sacco Micro and the industry. It is only for reprinting and sharing to support the protection of intellectual property rights. Please indicate the original source and author when reprinting. If there is any infringement, please contact us to delete it.
Company Tel: +86-0755-83044319
Fax/fax:+86-0755-83975897
Email: 1615456225@qq.com
QQ: 3518641314 Manager Li
QQ: 332496225 Manager Qiu
Address: Room 809, Block C, Zhantao Technology Building, No.1079 Minzhi Avenue, Longhua New District, Shenzhen
Site Map | 萨科微 | 金航标 | Slkor | Kinghelm
RU | FR | DE | IT | ES | PT | JA | KO | AR | TR | TH | MS | VI | MG | FA | ZH-TW | HR | BG | SD| GD | SN | SM | PS | LB | KY | KU | HAW | CO | AM | UZ | TG | SU | ST | ML | KK | NY | ZU | YO | TE | TA | SO| PA| NE | MN | MI | LA | LO | KM | KN
| JW | IG | HMN | HA | EO | CEB | BS | BN | UR | HT | KA | EU | AZ | HY | YI |MK | IS | BE | CY | GA | SW | SV | AF | FA | TR | TH | MT | HU | GL | ET | NL | DA | CS | FI | EL | HI | NO | PL | RO | CA | TL | IW | LV | ID | LT | SR | SQ | SL | UK
Copyright ©2015-2025 Shenzhen Slkor Micro Semicon Co., Ltd